

1. 서론
1.1 연구의 배경 및 목적
1.2 연구의 범위 및 방법
2. 이론적 고찰
2.1 지표면 가중평균의 개념
2.2 수치지형도 디지털 데이터의 체계
2.3 지표면 가중평균 산정 응용 소프트웨어
3. 지표면 가중평균 산정 Grasshopper 알고리즘
3.1 연구대상지 설정
3.2 지표면 가중평균 산정 Grasshopper 알고리즘 효과
3.3 지표면 가중평균 산정 Grasshopper 알고리즘 개요
4. 알고리즘 Module 구성
4.1 Data Reader (Module 01)
4.2 Basic Setting & Mass Input (Module 02)
4.3 Data Operation (Module 03)
4.4 Weighted average numerical objects (Module 04)
4.5 Weighted average numerical values (Module 05)
4.6 Process Overview Example
5. 결론
5.1 지표면 가중평균 법정산정 알고리즘의 효율성
5.2 지표면 가중평균 법정산정 알고리즘의 신뢰성
5.3 지표면 가중평균 법정산정 알고리즘의 확장성
5.4 지표면 가중평균 법정산정 알고리즘의 제한성
1. 서론
1.1 연구의 배경 및 목적
국토 전체의 77.4%가 산지로 이루어진 한반도는 1960년도 이후 산업화와 도시의 확장으로 인하여 수도권 인구집중 및 건축물의 수요가 증가하였다. 건축물의 수요 증가로 도시는 빠르게 팽창하였으며, 자연스럽게 경사지의 개발이 가속화되었다(Min & Kim, 2009). 이에 따라 건축가에게 설계검토과정에서 경사지 개발을 위한 많은 시간이 요구되고 있다. 경사진 지형에 건축물을 설계하는 경우에 건축법의 적용이 어려우며, 이러한 규정은 건폐율, 용적률, 건축물의 층수 및 연면적 등 건축 관련 법령에서 건축물을 규제하는 수단이 되어 건축물 볼륨에 전반적인 영향을 미친다(Kim & Lee, 2003). 경사지에서 건축 규정들을 적용하기 위해서 건축물의 높이 산정, 지하층 산정의 기준이 되는 지표면의 가중평균을 올바르게 산정하는 것이 중요하다.
지표면의 가중평균은 건축법령의 규정 내용에 의존하고 있는데, 관련된 건축법은 건축물의 높이 제한 기준 산정(건축법시행령 제119조 제2항)과 건축물의 지하층 산정 (건축법 제2조 제1항5호)이 각각 다르다. 지표면 가중평균 산정이 다른 관계로 초기 건축설계단계에서 건축물의 다양한 설계안의 변경에 대한 시도를 경사지에 반영하기 위한 시간과 인력의 소비가 요구된다.
본 연구에서는 기획설계의 초기단계에서 지표면의 가중평균 산정 자동화에 대한 방법을 알아보고자 한다. 3D Modeling 디자인 단계에서 건축 매스의 이동 및 형태 변형을 적용하였을 때, 건축물의 높이와 지하층 산정을 위한 지표면 가중평균을 Grasshopper 알고리즘을 통해 산정한다. 이를 통해 기존 Process 대비 소요시간을 단축하고, 다양한 디자인 시도를 할 수 있도록 하고자 한다.
1.2 연구의 범위 및 방법
본 연구는 3D Modeling 소프트웨어 Rhino3d와 Grasshopper 알고리즘을 이용한 지표면 가중평균 법정산정 자동화 Process에 초점을 맞추었다.
(1) 지표면 가중평균 산정 자동화를 위한 주변 지형과 주변 건축물을 Grasshopper 알고리즘을 통해 Rhino3d 화면상에서 구현한다. 지형과 건축물 3D Modeling에 소비되는 시간을 최소화하기 위해 국토지리정보원에서 제공하는 수치지형도 데이터를 이용하였다.
(2) 지형 3D Model을 참고하여 Rhino3d에서 디자인한 건축 매스를 Grasshopper 알고리즘에 입력한다.
(3) 입력된 건축 매스의 이동 및 지하 근입깊이, 형태 변형, 층고의 변수를 적용하였을 때마다 Grasshopper 알고리즘을 통해 지표면의 가중평균을 자동으로 산정한다.
(4) 건축물의 높이와 지하층 산정에 적용되는 데이터를 추출하여 지표면 가중평균 산정 규정과 관련된 법규 준수의 여부를 검토할 수 있도록 하였다.
2. 이론적 고찰
2.1 지표면 가중평균의 개념
건축물의 높이와 지하층 산정은 산지가 많은 한반도의 다양한 지형에서 적용되어야 하므로 법정산정 규정에 따른 평균 높이로 측정한 값으로 인정한다. 측정한 평균 높이를 각각 건축물의 높이 제한 기준과 지하층 산정을 위한 지표면의 가중평균이라고 하며, 고저차가 있는 경사지에 건축물을 건축할 경우 적용된다. 지표면 가중평균은 건축물이 지표면에 접한 접지면적(㎡)을 접지둘레(m)로 나눈 값이며, 본 연구에서는 건축물의 높이와 지하층 산정을 위한 가중평균에 초점을 맞추었다.
2.1.1 건축물의 높이와 지하층 산정
건축물의 높이는 지표면으로부터의 수직거리를 산정하며, 고저차가 있는 지형에 건축물을 건축할 경우 높이 산정을 위한 지표면 가중평균을 적용하여 산정한다.
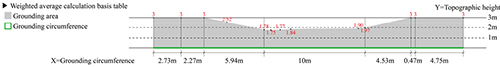
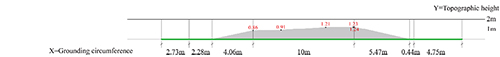
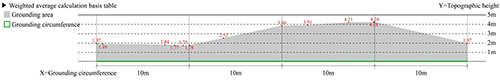
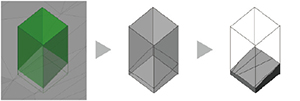
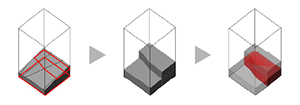
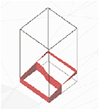
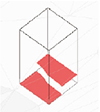
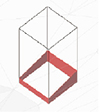
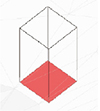
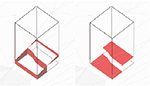
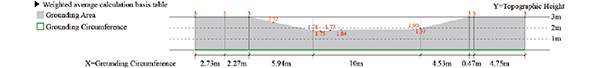
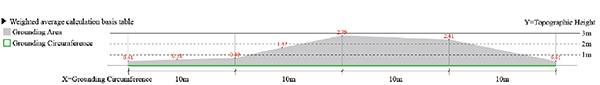
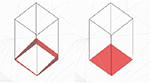
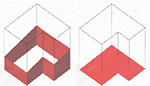
고저차 3m 초과의 경우 지표면의 가중평균은 Figure 1과 같이 건축물의 아래에서부터 수직으로 3m씩 끊어 산정한다. 단일 건축물이라도 Figure 2와 같이 3m 간격의 영역별 지표면을 통해 높이를 산정하여 건축물의 형태가 달라질 수 있다. 고저차 3m 이하의 경우, Figure 1, 2의 A영역으로 이루어진 건축면적 100㎡의 건축 매스를 예로 들 수 있다. A영역 건축 매스의 경우, 수직으로 3m씩 끊지 않고 단순계산하여 지하층 산정을 위한 지표면 가중평균이 같다.
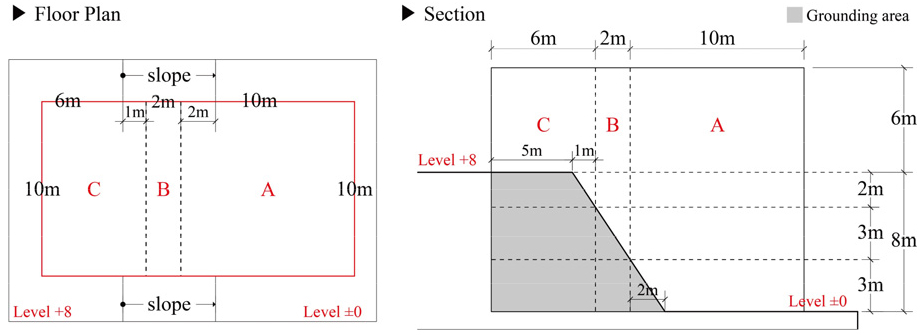
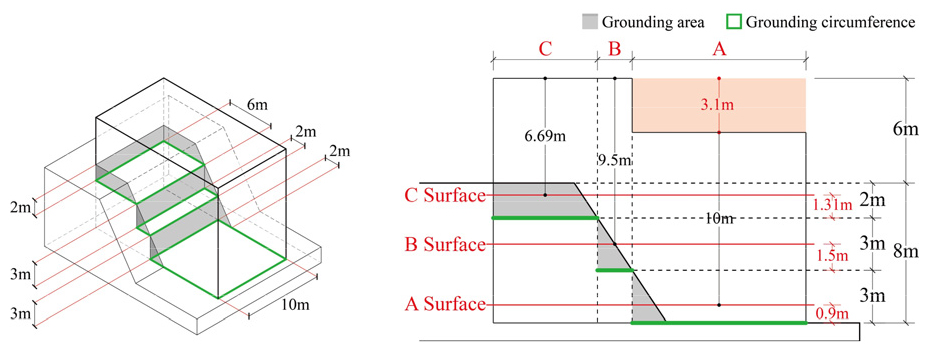
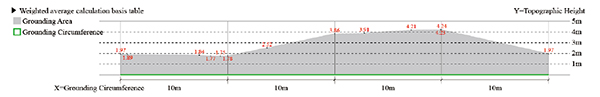
Figure 2와 같이 건축물이 고저차 8m인 경지에 위치할 경우, 수직으로 3m씩 끊어 나눈 3곳의 영역으로 나누어 각각의 접지면과 접지둘레를 이용하여 가중평균을 산정한다. 건축물의 높이 제한이 10m일 경우, Figure 2와 같이 A영역의 건축물 높이는 3.1m를 초과하므로 건축물의 높이 제한 규정이 적용되어 건축물의 형태가 바뀐다.
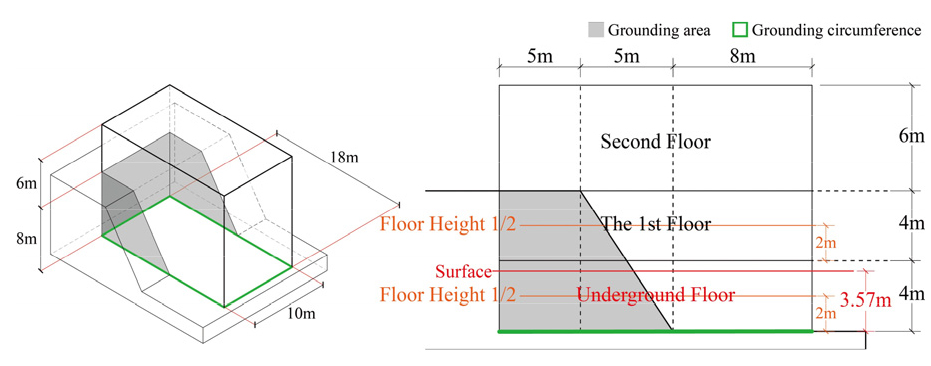
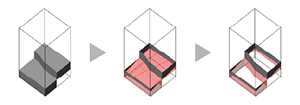
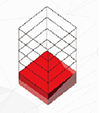
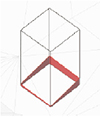
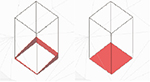
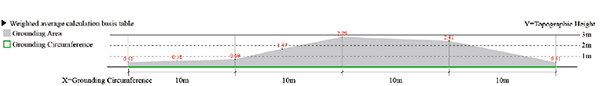
건축물의 지하층은 건축물의 바닥이 평균 지표면 아래에 있는 층이면서, 바닥에서 지표면 가중평균까지 높이가 해당 층 층고의 1/2이상인 것을 말한다. 고저차가 있는 지형에 건축물을 건축할 경우, 지하층 산정을 위한 지표면 가중평균은 Figure 3과 같이 지형에 접한 건축물의 접지면적을 접지둘레로 나눈 값이 지하층을 위한 지표면 가중평균이 되므로 1층 4m, 2층 4m, 3층 6m의 층고를 가진 건축물일 경우, 첫 번째 층이 지하층으로 산정된다.
2.2 수치지형도 디지털 데이터의 체계
현재 한반도 수치지형도를 제작되고 있는 축척은 1/1,000, 1/2,500, 1/5,000. 1/25,000이 있으며 1/5,000과 1/25,000 축척의 수치지형도 데이터는 국토지리정보원에서 전 국토에 대해 제작 및 관리하고 있다. 국토지리정보원에서 제공하는 수치지형도 데이터의 유형은 도엽단위 데이터인 1.0 및 2.0 버전이 있으며 레이어 단위 데이터인 연속 2.0 버전으로 구분되어 있으며, 버전에 따라 내포하고 있는 데이터의 포맷 종류가 다르다.
1.0 버전의 경우 지리조사 및 현지측량에서 얻어진 데이터를 말하며, 도형데이터와 주기로 구성되어 CAD 데이터 형식이며 dxf, dwg 포맷으로 제공된다.
2.0 버전의 경우 데이터 간의 지리적 상관관계를 파악하기 위하여 지형 및 지물을 기하학적 형태로 구성하는 편집과정을 거친 데이터로, 지형지물 객체별로 도형과 속성이 결합된 형식으로 GIS 데이터 형식의 파일로 Shape, NGI 포맷으로 제공된다.
수치지형도 연속 2.0 버전의 경우 도엽단위의 수치지형도를 동일 지형 및 지물 레이어와 연결하여 대상 지역 전체 끊김없이 연결되어있는 데이터이다. 연속 2.0 버전 레이어는 Table 1과 같이 레이어의 축척, 레이어의 공간형태, 지형지물의 분류 등에 따라 명명되어 구분한다. 사용자가 범위를 직접 설정할 수 있어 편리하며, 2.0 버전과 같은 Shape, NGI 포맷으로 제공된다.
Table 1.
Digital topography map version 2.0 layer
Shape파일은 지리적 형상의 기하학적인 위치와 속성 정보를 저장할 수 있는 파일 포맷으로 기능에 따라 다양한 확장자 포맷으로 구성되어진다(shp, shx, dbf, prj, sbn, sbx, xml). 각각의 기능은 Table 1과 같다. 여기서 필요한 파일은 shp, shx, dbf파일이며, 본 연구는 국토지리정보원에서 제공하는 shp, shx, dbf, prj 포맷의 수치지형도 연속 2.0버전 Shape파일을 이용하였다.
Table 2.
Features of the shape file format
본 연구는 지표면 가중평균 산정에 필요한 지형과 주변 건축물 데이터를 구현하기 위해 등고선과 건축물 레이어 데이터를 중심으로 Shape 파일의 수치지형도 연속 2.0 버전 1/1,000 축척 데이터를 채택하였다.
등고선 데이터는 등고선의 형상정보가 저장되어있는 N1L_F0010000.shp 파일과 등고수치 값을 포함하고 있는 dBASE인 N1L_F0010000.dbf 파일, 형상정보의 Index를 저장하고 있는 N1L_F0010000.shx 파일, 등고선의 좌표계 정보를 저장하고 있는 N1L_F0010000.prj 파일을 이용하였다.
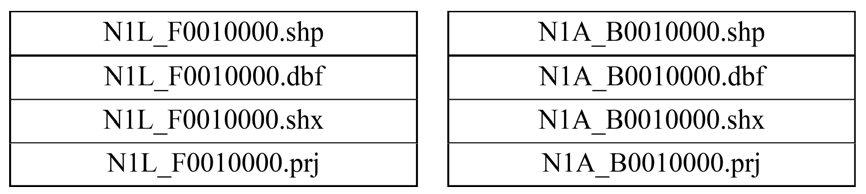
건축물 데이터는 건축물의 형상정보가 저장되어있는 N1A_B0010000.shp 파일과 건축물의 층수 값을 포함하고 있는 dBASE인 N1A_B0010000.dbf 파일, 형상정보의 Index를 저장하고 있는 N1A_B0010000.shx 파일, 건축물의 좌표계 정보를 저장하고 있는 N1A_B0010000.prj 파일을 이용하였다.
2.3 지표면 가중평균 산정 응용 소프트웨어
과거 그래픽 소프트웨어는 디자인 작업을 위한 보조적인 수단에 불과했지만, 현대의 디자인 산업에서 계속해서 발전하고 있는 컴퓨터의 기술과 3D Modeling 소프트웨어는 단순한 도구를 넘어 필수 요소가 되었다. 3D Modeling 소프트웨어는 항상 변화의 상태에 있으며, 객관적인 데이터를 기반으로 혁신적이고 새로운 디자인 방법론 및 결과물이 만들어지고 있다(Kim, 2014). 3D Modeling 소프트웨어 Rhino3d는 Plug-in으로 사용되는 Grasshopper 소프트웨어를 통해 사용자가 특정한 매개변수를 입력하고 통제함으로써 사용자의 디자인 의도를 시각화할 수 있게 되었다(Kim, 2016).
최근 Grasshopper를 이용하여 건축 매스 3D Modeling에 활용하는 다양한 연구가 진행되고 있다. 건축설계의 기초단계에 있어 건축 매스의 최적화를 사용자의 입력값 또는 신속으로 무작위의 값을 입력 및 추출하여(Wang, 2022) 건축 매스 형태 신속화에 관하여 연구하거나, 건축법규를 적용하여 아파트의 최적화 배치 신속화(Sung & Jeong, 2020)로 건축법을 적용한 배치에 초점을 맞춘 연구가 존재한다. 이처럼 Grasshopper를 통해 사용자의 입력 매개변수에 따라 사용자의 Process를 구축할 수 있으며, 다양한 형태와 결과값을 도출할 수 있는 장점이 있어 다양한 연구에 쓰일 수 있다.
2.3.1 Shape 데이터 입력 Grasshopper Component
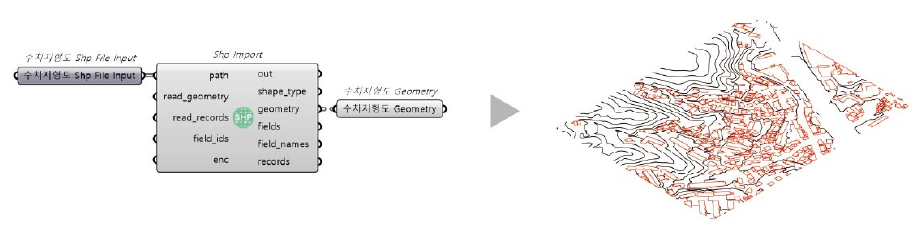
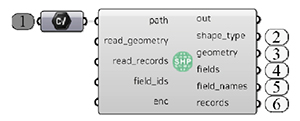
본 연구는 지형과 건축물을 Rhino3d 화면상에서 3D Model로 구현하기 위해 Shp Import Component를 이용하였다(Figure 6). 해당 Component는 Rhino3d Plug-in 설치 커뮤니티인 Food4rhino.com과 소프트웨어 오픈소스를 무료로 제공하는 Github.com를 통해 무료로 설치할 수 있다.
Shp Import Component는 shp파일을 File Path Component를 통해 입력하여 연산하는데, Shape파일의 필수적인 shp, shx, dbf파일이 같은 경로에 있어야 Component가 정상적으로 작동한다. 이는 shp파일의 형상정보뿐만 아닌 shx파일의 형상정보의 속성, dbf파일의 dBASE를 불러오기 위함이다. 본 연구는 좌표계 정보를 내포하고 있는 prj파일도 포함하여 shp파일과 같은 경로에 저장하여 진행하였다. 입력한 Shape파일의 수치지형도 데이터를 통해 shp파일의 등고선과 건축물 형상정보를 prj파일의 좌표계 위치로 Rhino3d의 3D Modeling 객체로 추출할 수 있으며, dbf파일이 내포하고 있는 등고수치와 층수 값을 추출할 수 있다. 이를 통해 지형 및 주변 건축물을 3D Model로 구현할 수 있는 기반이 되며, 가중평균 산정을 위한 3D Modeling에 소비되는 시간을 최소화할 수 있다.
Table 3.
Process of outputting shp file data
3. 지표면 가중평균 산정 Grasshopper 알고리즘
3.1 연구대상지 설정
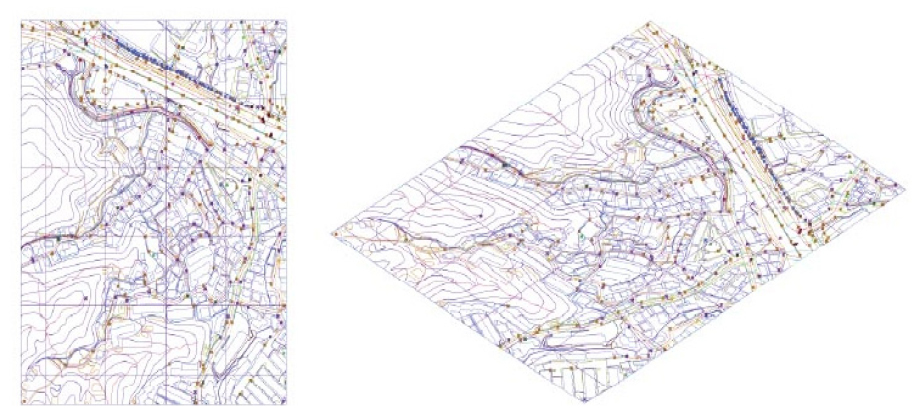
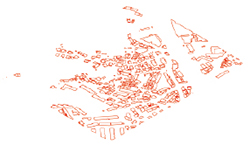
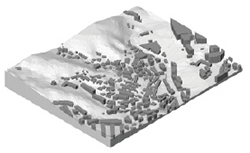
본 연구에서는 경사지가 많은 대상지를 선정하기 위해 대체로 굽이진 지형을 가지고 있는 정릉동을 선정하였다. 서울시 성북구 정릉동은 북한산 자락을 타고 형성된 지형으로 달동네가 밀집되어 있으며, 특히 경사가 심한 정릉골이 속해있는 정릉3동을 선정하여 연구를 진행하였다.
3.2 지표면 가중평균 산정 Grasshopper 알고리즘 효과
본 연구는 지표면 가중평균 산정에 있어 기존 Process 대비 신속화하는 방법을 Grasshopper 알고리즘을 통해 구현하였다. Grasshopper 알고리즘을 통한 지표면 가중평균 산정을 자동화하여 테스트한 결과, 기존 Process의 CAD기반 산정 소요시간 대비 Grasshopper 알고리즘을 통한 산정 소요시간이 약 120배 차이가 난다(Table 4). 이를 통해 소비되는 시간뿐만 아니라 투입되는 인적 자원을 최소화할 수 있을 것으로 보인다. 건축물의 높이와 지하층 산정 소요시간의 자동화로 일정 시간 내에 설계자가 다양한 디자인을 시도해볼 수 있을 것으로 판단된다.
Table 4.
A Surface weighted average calculation method using 3d modeling

3.3 지표면 가중평균 산정 Grasshopper 알고리즘 개요
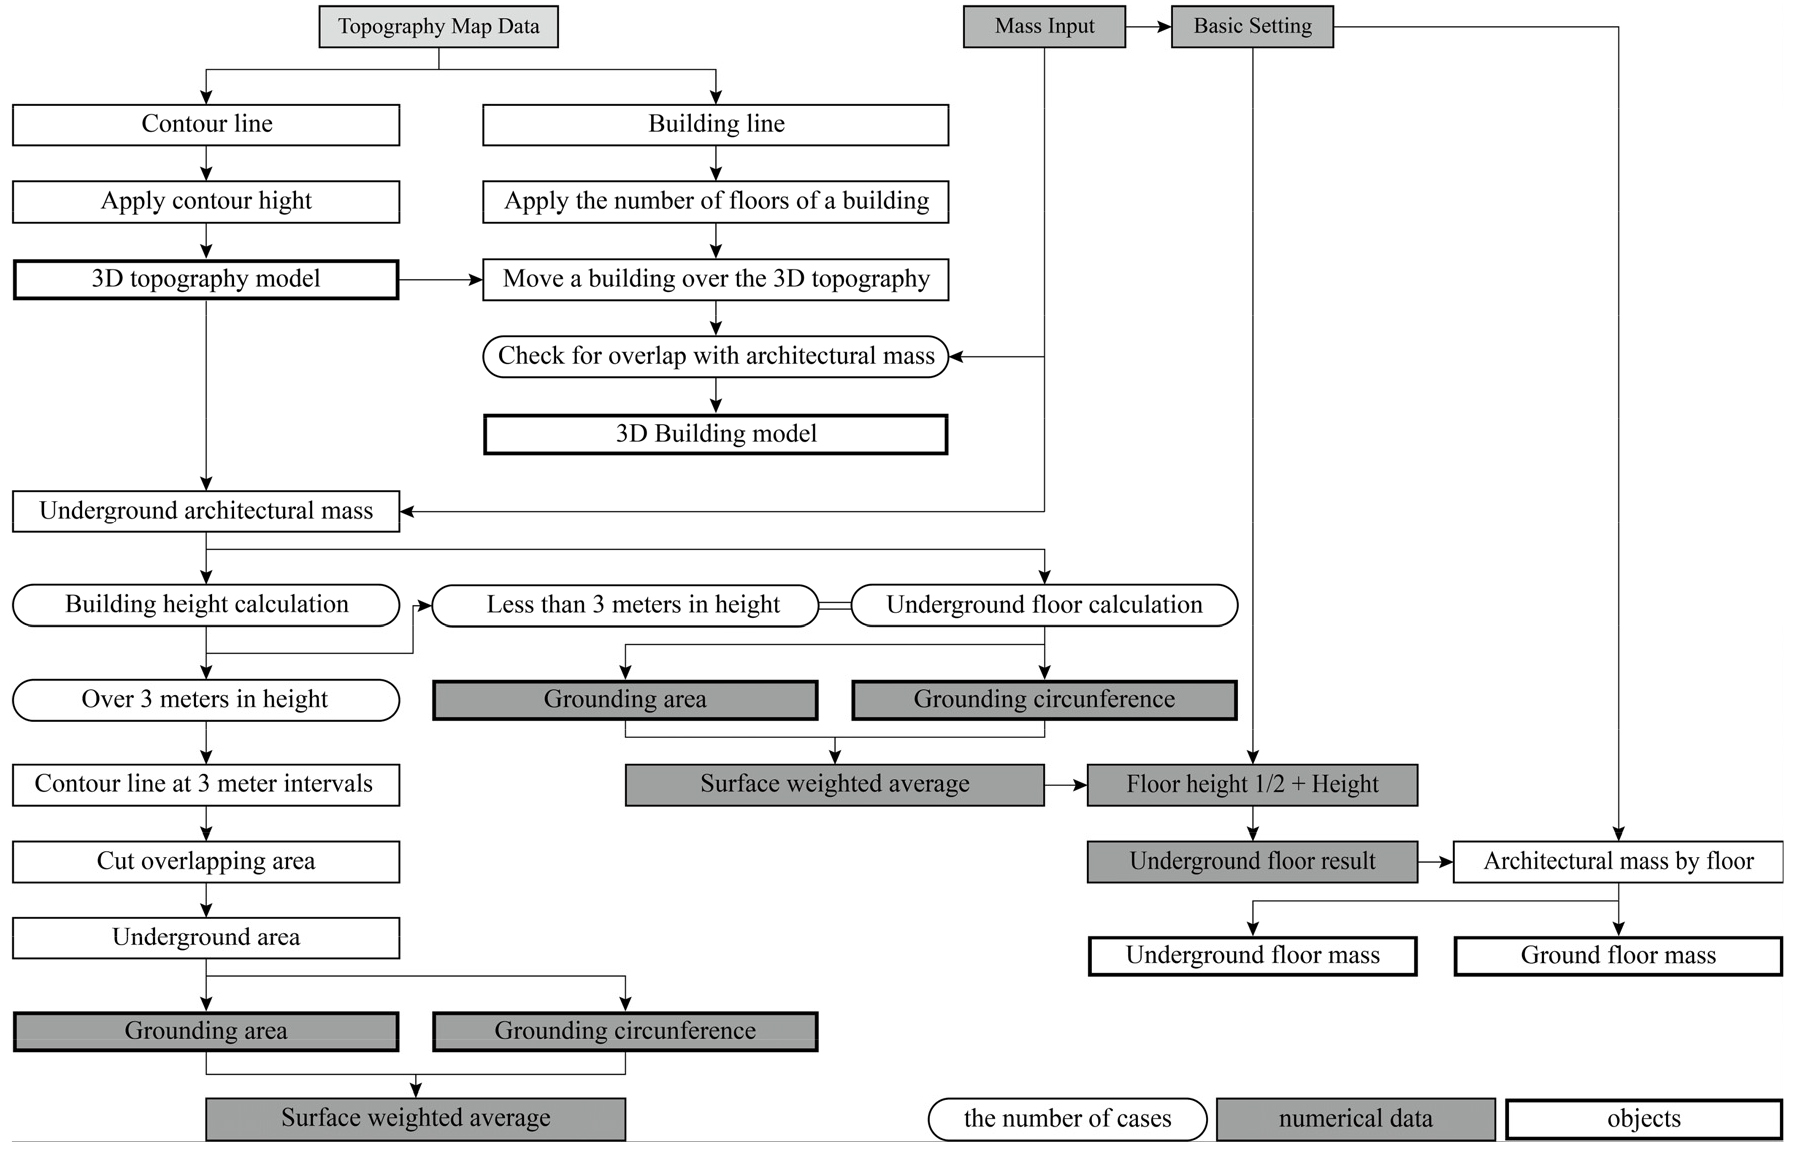
Rhino3d의 Grasshopper를 통한 지표면 가중평균 법정산정 자동화 알고리즘의 전체 Process는 Figure 7과 같이 Data Input, Date Setting, Data Operation, Data Output으로 구성되어 있다.
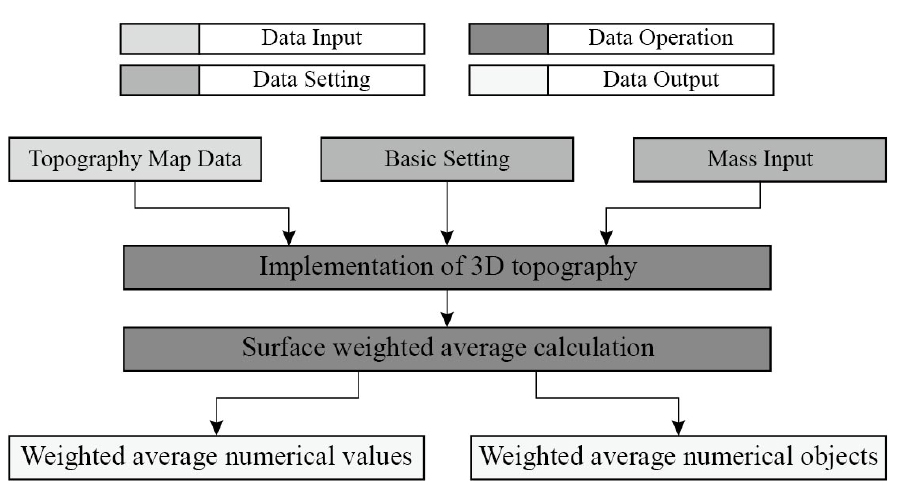
3.3.1 Data Input
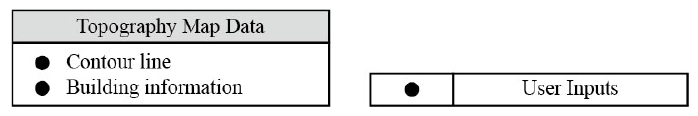
Data Input 과정은 수치지형도 연속 2.0 버전 데이터의 등고선(N1L_F0010000.shp)과 건축물(N1A_B0010000.shp) 파일 입력을 통해 연산된다. shp파일은 Shp Import Component를 통해 입력되며, 등고선과 건축물의 형상정보를 추출한다. 등고선의 등고수치와 건축물의 층수 값은 shp파일의 같은 경로의 dbf파일을 통해 추출한다. 추출한 데이터를 통해 지형과 건축물 3D Modeling을 진행한다.
3.3.2 Data Setting
Data Setting 과정은 건축 매스의 지표면 가중평균 산정을 위한 전체 Process의 조건을 설정한다. Rhino3d에서 설정되어있는 단위를 선택하고, 입력될 건축 매스의 층수와 층고 데이터를 입력한다. 입력된 층수와 층고 데이터를 통해 건축 매스의 지하층 산정에 적용된다.
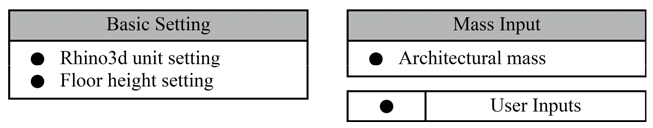
3.3.3 Data Operation
Data Input과 Data Setting 과정에서 입력된 수치지형도 데이터와 기초 설정 및 건축 매스의 입력을 기반으로 지형 및 건축물의 3D Model 구현과 건축 매스의 영역별 높이와 지하층 산정을 위한 가중평균을 연산한다.
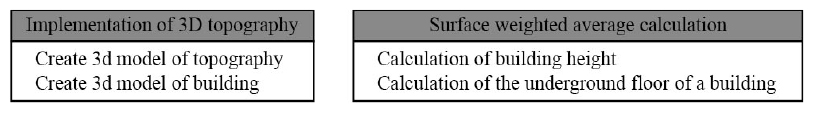
3.3.4 Data Output
지형 3D Model에 접한 건축 매스의 지표면 가중평균을 산정하고 관련된 데이터를 추출하는 과정이다. Figure 11과 같이 건축 매스의 높이 산정과 지하층 산정을 위한 지표면 가중평균 산정에 적용된 접지면과 접지둘레, 수치값을 추출한다.
4. 알고리즘 Module 구성
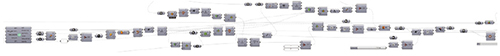
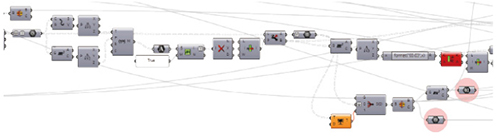
해당 알고리즘은 Figure 7을 기반으로 수치지형도를 이용하여 지형 및 주변 건축물의 3D Modeling과 건축 매스의 가중평균 산정 자동화를 위한 Grasshopper 알고리즘을 Figure 12, Table 5와 같이 구성하였다.
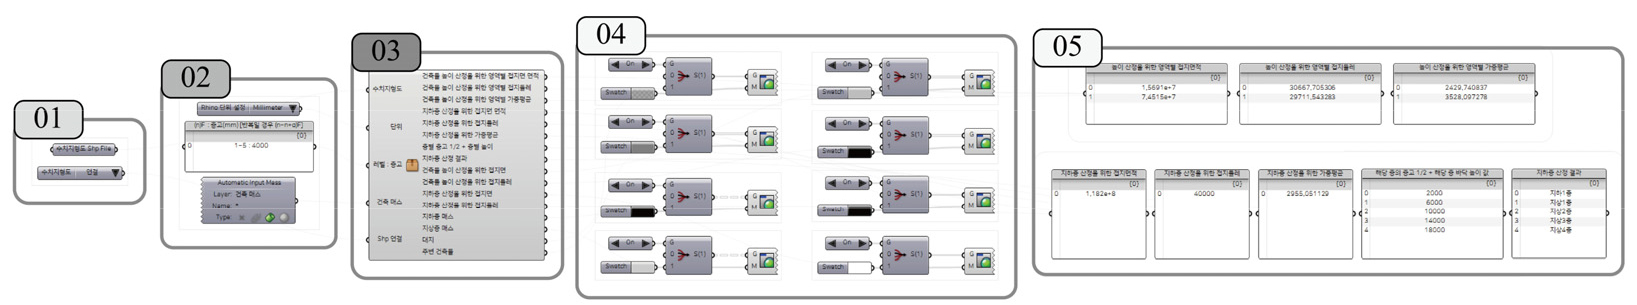
Table 5.
Clusters & modules of the definition
4.1 Data Reader (Module 01)
해당 Module은 지형과 주변 건축물 3D Model을 생성하기 위한 수치지형도 데이터를 불러오는 과정으로, File Path Component를 이용하여 등고선(N1L_F0010000.shp)과 건축물(N1A_B0010000.shp) 파일을 입력한다(Table 6).
Table 6.
Data reader(Module 01)
| Component | Description |
| File Path | 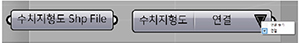 |
| Digital topographic map data for generating 3D topography features are retrieved. |
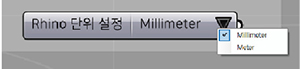
4.2 Basic Setting & Mass Input (Module 02)
Rhino3d를 이용한 건축 설계 과정에서 이용되는 단위의 설정은 주로 mm와 m단위가 사용되는데, 2가지의 단위를 모두 설정할 수 있도록 하였다.
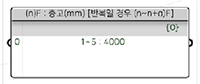
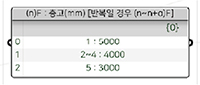
Panel Component를 통해 건축 매스에 적용할 층수와 층고 값을 입력한다. 층수와 층고 적용은 Table 7과 같이 해당 층(n)과 콜론( : )입력하고 ㎜단위의 층고를 입력한다. 층고 값이 반복일 경우 해당 층(n)에서 최종 층(n+α) 사이에 물결표(~)를 입력하여 층고 값을 입력한다. 해당 과정 중에서 층고 값의 합은 건축 매스의 높이 값을 초과하지 않도록 한다. 입력된 층수 및 층고 값은 Module 04 과정을 통해 지표면 가중평균이 적용되어 건축 매스의 지하층이 산정된다.
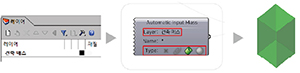
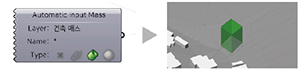
건축 매스가 자동으로 입력되는 과정을 위해 Geometry Pipeline Component를 이용하였다. 건축 매스는 Table 7과 같이 Geometry Pipeline Component의 레이어 명칭이 Rhino3d에서 명명된 레이어 명칭과 같아야 하며, 건축 매스의 Type을 설정하여 자동으로 입력된다. Geometry Pipeline Component에서 불러올 수 있는 Type은 Point, Curve, Brep, Mesh가 있는데, 본 연구에서는 Brep Type으로 설정하여 건축 매스가 자동으로 입력될 수 있도록 하였다.
Table 7.
Basic setting & mass input(Module 02)
4.3 Data Operation (Module 03)
Module 01에서 입력된 등고선(N1L_F0010000.shp)과 건축물(N1A_B0010000.shp) 파일은 Shp Import Component를 통해 등고선과 건축물의 형상을 추출하고, shp파일과 같은 경로의 등고선(N1L_F0010000.dbf)파일과 건축물(N1A_B0010000.dbf)파일의 dBASE를 기반으로 Shp Import Component에서 등고선의 등고수치와 건축물의 층수 값을 추출하여 지형 및 건축물을 3D Model로 생성하는 과정은 각각 Table 9, 10과 같다.
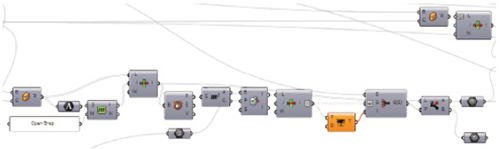
건축 매스의 높이 산정을 위한 영역별 가중평균과 지하층 산정을 위한 지표면 가중평균을 연산하는 과정을 거친다. 해당 과정은 Component의 간략화를 위해 Cluster로 작성하였다(Figure 12). 본 과정에서 지형과 주변 건축물 3D Modeling 및 지표면 가중평균 법정산정의 자동화를 위한 Data Operation은 Table 8, Figure 13과 같다.
Table 8.
Data operation(Module 03)
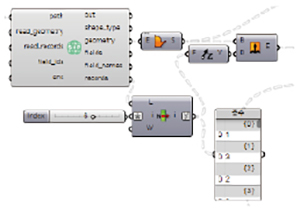
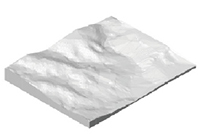
Table 9는 Figure 13의 과정에 포함되며, Module 01에서 입력된 등고선(N1L_F0010000.shp)파일을 기반으로 등고선을 생성하고, 등고수치 값은 N1L_F0010000.dbf 파일의 dBASE에서 Shp Import Component의 records를 통해 추출한다. 추출된 dBASE의 Index 중 등고수치의 Index를 적용하여 등고수치를 추출한다. 이를 통해 등고수치가 적용된 등고선을 생성할 수 있으며, Delaunay Mesh Component를 통해 지형 3D Model로 생성한다. 본 연구는 N1L_F0010 000.dbf 파일의 등고수치 간격 5m를 기본으로 적용하여 지형을 생성하였다.
Table 9.
Create 3D topography model using shape file

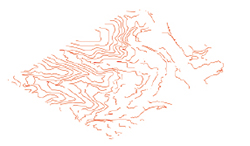
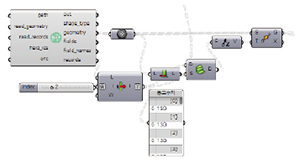
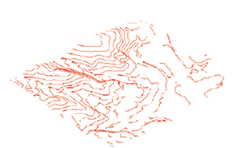
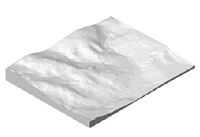
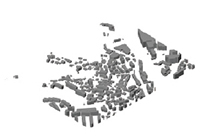
Table 10은 Figure 13의 과정으로, Module 01에서 입력된 건축물(N1A_B0010000.shp)파일을 기반으로 건축물의 2D 형상을 생성하고, 건축물의 층수 값은 N1A_B0010000.dbf 파일의 dBASE에서 Shp Import Component의 records로 추출한다. 추출된 dBASE의 Index 중 건축물의 층수 값의 Index를 적용하여 층수 값을 추출한다. 이를 통해 건축물의 층수가 적용된 건축물 객체를 생성할 수 있으며, Table 9에서 생성된 지형 3D Model과 접하는 건축물 바닥의 z축의 값 위치로 이동하여 주변 건축물 객체를 지형 3D Model 위로 얹은 상태의 주변 건축물 3D Model을 생성한다.
Table 10.
Create 3D building model using shape file
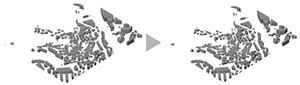
주변 건축물 생성의 최종과정은 Table 11에서 입력될 건축 매스와 주변 건축물이 접하는 경우, 해당 건축물을 제외하여 생성하는 과정을 거쳐 건축물 3D Model로 생성한다. 본 연구는 N1A_B0010000.dbf 파일의 층수 값은 전체 건축물에 동일한 4m의 층고 값으로 적용하여 주변 건축물을 생성하였다.
Table 11.
Architectural mass input
| Description |
 |
| Enter the architectural mass for calculating the weighted average of the surface. |
Module 02(Table 7)에서 명명된 Rhino3d 레이어를 통해 건축 매스가 Table 11과 같이 Grasshopper에 자동입력된다. Table 11은 Figure 13의 과정에서 Mass Input 과정에 포함된다. 건축 매스의 위치에 따라 Table 10과 같이 주변 건축물과 접할 경우, 해당 건축물을 제외하는 과정을 거친다.
해당 과정은 Figure 13과 같이 입력된 건축 매스를 통해 주변 건축물을 생성하는 최종단계에 포함되며, 건축 매스가 지하에 접한 형태를 추출하는 단계로 진행된다.
Table 12.
Underground architectural mass
| Grasshopper algorithm process | |
 | |
 | It outputs the architectural mass form facing the underground. |
Table 12는 Figure 13에서 지형 3D Model을 생성하는 과정을 거친 후에 포함되는 과정이며, Table 11을 통해 입력된 건축 매스는 지형 3D Model과 작용하여 건축 매스가 지하에 접한 객체를 추출하는 과정이다.
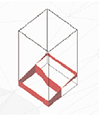
해당 과정은 건축 매스의 영역별 높이 산정과 지하층 산정의 지표면 가중평균 산정을 위한 초기 단계이며, 지하에 접한 형태를 추출하기 위해 Split Component를 이용하여 건축 매스를 지형의 면을 통해 Split한다.
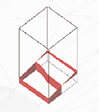
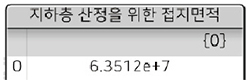
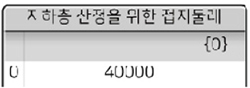
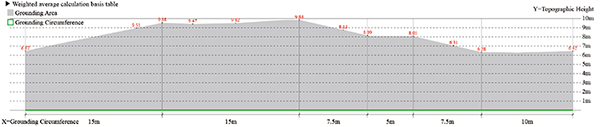
Table 13은 건축 매스가 지하에 접한 접지면과 접지둘레를 추출하는 과정이다. 이는 Table 12에서 추출된 객체를 Deconstruct Brep Component를 통해 해당 객체의 지형의 면으로 결합된 상하부 면을 제거하여 건축 매스가 지하에 접한 접지면을 추출한다. 지하층 산정을 위한 접지둘레를 추출하기 위해 접지면 객체와 Deconstruct Brep Component를 이용하여 추출한다. 이를 통해 지하층 산정을 위한 접지면적과 접지둘레의 수치값을 추출할 수 있으며, 해당 수치값을 통해 건축 매스의 지하층 산정을 위한 지표면 가중평균을 추출할 수 있다(Figure 13).
Table 13.
Output for underground floor calculation
| Grasshopper algorithm process | ||
 | ||
 |  | Output the grounding area and grounding circumference for underground floor calculation |
Table 12를 통해 추출된 객체의 고저차가 3m 이하인 경우, 지하층 산정을 위한 지표면 가중평균 산정과정과 같은 과정을 거치므로 건축 매스의 높이 산정을 위한 지표면 가중평균 산정과정은 건축 매스가 지하에 접한 객체의 고저차가 3m를 초과하여 건축 매스의 높이 3m 간격의 영역별 높이 산정과정인 Table 14를 거치지 않고 Table 13과 같은 과정을 거쳐 건축 매스의 높이 산정을 위한 지표면 가중평균을 추출할 수 있다(Figure 13).
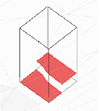
Table 14.
Output for building height calculation
| Grasshopper algorithm process | ||
 | ||
 | Contour line at 3 meter intervals | |
 | Cut overlapping area and Cut ground area | |
 |  | Output the grounding area and grounding circumference for height calculation |
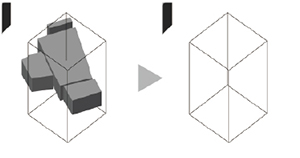
Table 14는 Table 12에서 추출된 건축 매스가 지하에 접한 형태의 고저차가 3m를 초과하는 경우, 수직 3m 간격의 영역별 건축 매스의 높이 산정을 위한 지표면 가중평균을 산정을 위한 과정으로 Figure 13에 포함된다.
Table 12에서 추출된 건축 매스가 지하에 접한 객체를 Contour Component와 작용하여 수직 3m 간격의 영역의 Solid 객체를 생성하고, Solid 객체끼리 접하는 영역을 Solid Difference Component를 통해 제거한다. 이를 통해 수직 3m 간격의 영역별 Solid 객체가 추출된다. 3m 간격의 영역별 Solid 객체는 Deconstruct Brep Component를 통해 상하부 면을 제거한 후, Table 9에서 추출한 지형의 면과 Split Component를 통해 건축 매스가 지하에 접한 수직 3m 간격의 영역별 지하에 접한 접지면 객체를 추출한다. 수직 3m 간격의 영역별 지하에 접한 접지둘레는 접지면 객체와 Deconstruct Brep Component를 이용하여 추출한다. 해당 과정 중에서 수직 3m 간격의 영역별 접지면 중 접지면 전체가 지하에 접하는 경우, 해당 접지면은 추출하지 않고 지표면 가중평균에 해당 접지면의 높이 값을 더한다.
Table 14를 통해 건축 매스가 지하에 접한 객체가 고저차 3m를 초과하는 경우, 영역별 접지면과 접지둘레를 추출할 수 있다. 접지면과 접지둘레를 통해 접지면적과 접지둘레의 수치값을 추출할 수 있으며, 해당 수치값을 통해 건축 매스의 높이 산정을 위한 영역별 지표면 가중평균을 추출할 수 있다.
Table 15.
Underground floor & ground floor mass output
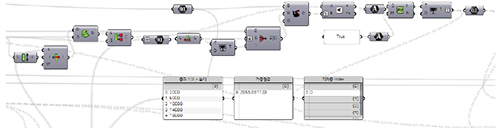
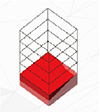
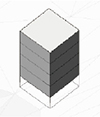
Table 15는 Table 13에서 산정한 건축 매스의 지하층 산정을 위한 지표면 가중평균을 적용하여 지하층과 지상층의 매스를 추출하는 과정으로 Figure 13에 포함된다.
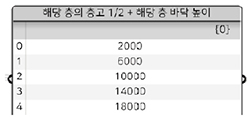
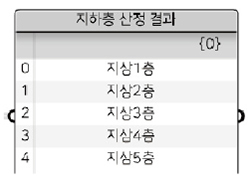
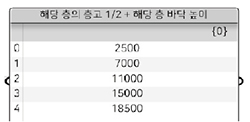
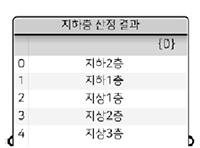
Module 02(Table 7)에서 입력된 층수와 층고 값을 통해 Table 15에서 각 층의 층고의 1/2 값과 해당 층의 높이 값을 더하여 지하층 산정을 위한 지표면 가중평균과 비교할 수 있는 수치값을 추출한다. 해당 수치값과 Table 13에서 산정된 지하층 산정을 위한 지표면 가중평균과 비교하여 지표면 가중평균보다 낮은 값의 높이 값의 Index를 추출하여 해당 Index의 지하층과 지상층 매스를 Dispatch Component를 이용하여 각각 추출한다.
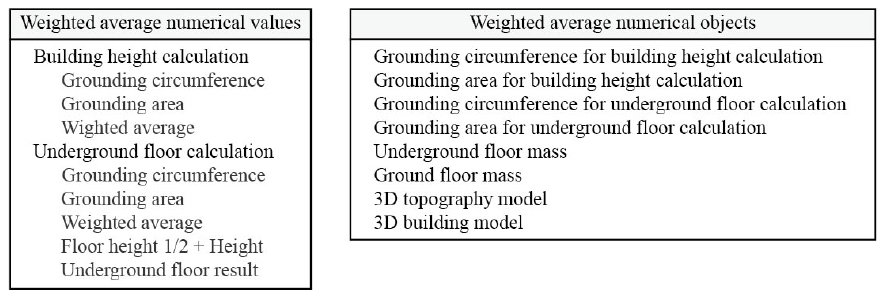
4.4 Weighted average numerical objects (Module 04)
Table 16.
Weighted average numerical objects(Module 04)
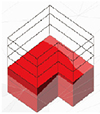
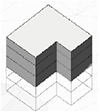
Module 04(Table 16)는 Figure 13의 과정을 통해 생성된 객체와 수치값을 시각화하는 과정이다. Table 9, 10을 통해 생성된 지형과 주변 건축물 3D Model을 시각화하며, Table 11을 통해 입력된 건축 매스를 기반으로 건축 매스의 지하층 산정(Table 13)과 높이 산정(Table 14)을 위한 영역별 접지면과 접지둘레를 시각화한다. Table 13에서 추출된 지하층 산정을 위한 지표면 가중평균을 통해 Table 15 과정을 거쳐 지하층과 지상층 매스를 시각화한다.
4.5 Weighted average numerical values (Module 05)
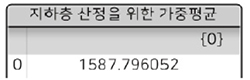
Module 02(Table 7)에서 입력된 건축 매스의 높이 산정을 위한 지표면의 가중평균과 지하층 산정을 위한 지표면의 가중평균과 관련된 수치값을 Table 17과 같이 추출한다. 추출된 수치값을 통해 지표면 가중평균 산정 규정과 관련된 법규 준수의 여부를 검토할 수 있다. Figure 12의 Module 05과 같이 ㎟단위와 ㎜단위로 추출된 수치값을 Table 17의 Grasshopper Panel Component를 통해 확인할 수 있다.
Table 17.
Weighted average numerical values(Module 05)
4.6 Process Overview Example
본 연구의 지표면 가중평균 법정산정 자동화를 위한 Grasshopper 알고리즘을 Table 18의 3가지 예시를 통해 작동 및 검토하고자 한다. 3가지의 예시는 2가지 형태의 건축 매스의 경우이다. 같은 형태를 가진 건축 매스의 위치와 지하 근입 깊이의 변수에 따른 경우와 기존 건축 매스의 형태 변형 및 층고 값의 변수에 따른 경우이다.
이를 통해 각각의 건축 매스의 위치와 지하 근입 깊이 및 형태 변형, 층고 값의 변수에 따른 적용이 가능한 것을 확인하고자 하며, 지표면 가중평균 법정산정 자동화를 위한 알고리즘의 신속성 및 편이성을 증명하고자 하였다.
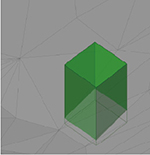
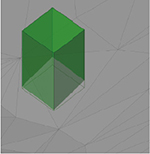
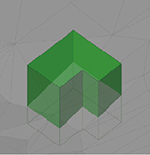
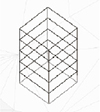
Table 18의 Alt 1과 2는 가로 10m, 세로 10m, 높이 20m인 건축면적 100㎡ 건축 매스의 위치와 근입 깊이의 변수에 따른 경우이다. Alt 3은 둘레 60m, 건축면적 187.5㎡인 건축 매스로 Alt 1과 2의 건축 매스와 다른 위치와 근입 깊이, 형태의 변수로 입력하였다. Alt 1과 2의 건축 매스는 층고 값이 같은 경우로 적용하였으며, 5개의 층으로 층고 4m의 동일한 값으로 설정하였다. Alt 3은 5개 층으로 1층부터 5층까지 5m, 4m, 4m, 4m, 3m의 각각 다른 층고 값이 경우로 설정하였다.
4.6.1 Alt 1
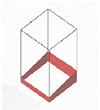
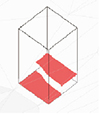
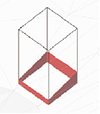
Table 18의 Alt 1의 경우, 고저차 3m를 초과하는 경사지에 위치한다. 고저차 3m를 초과하는 경우, 건축 매스 높이 산정을 위한 가중평균은 건축 매스의 아래에서부터 수직 3m 영역별로 산정하여 Table 19와 같이 건축 매스가 지하에 접한 접지면 및 접지둘레를 시각화한다.
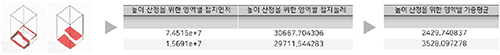
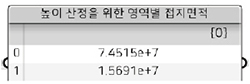
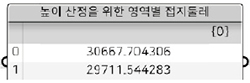
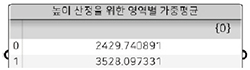
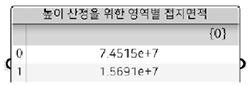
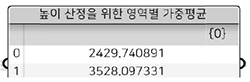
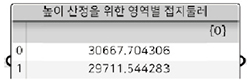
Table 19를 통해 Alt 1 건축 매스의 높이 산정을 위한 수직 3m 영역별 접지면적 값은 각각 약 74.51㎡, 15.69㎡이다. 높이 산정을 위한 접지둘레의 값은 수직 3m 영역별 각각 약 30.67m, 29.72m이다. Alt 1 건축 매스의 높이 산정을 위한 지표면 가중평균은 수직 3m 영역별 각각 약 2.43m, 3.53m이다. Alt 1 건축 매스의 높이 산정은 수직 3m 영역별 2.43m, 3.53m로 산정한다. 해당 영역별 지표면 가중평균을 통해 높이 제한이 적용될 경우, 건축 매스의 형태가 달라질 수 있다.
Table 19.
Objects and Figures for surface weighted ave:rage calculation, Alt 1
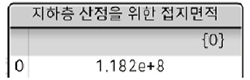
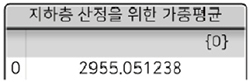
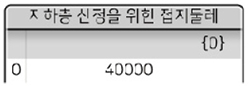
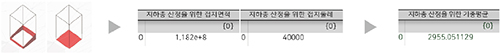
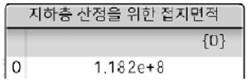
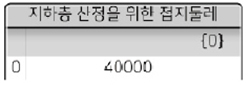
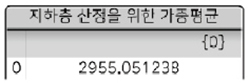
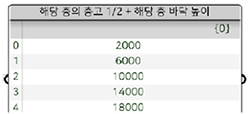
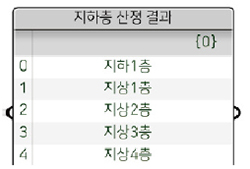
Alt 1 건축 매스의 지하층 산정을 위한 접지면적은 약 118.2㎡이며, 지하층 산정을 위한 접지둘레는 40m이므로 Alt 1 건축 매스의 지하층 산정을 위한 지표면 가중평균은 약 2.96m이다. Alt 1 건축 매스는 총 5개 층의 4m 층고를 설정하였으므로, 해당 층 층고의 1/2 값과 해당 층의 바닥 높이 값을 더한 값은 각각 1층 2m, 2층 6m, 3층 10m, 4층 14m, 5층 18m이다. 지하층 산정을 위한 지표면의 가중평균인 약 2.96m보다 낮은 값을 가진 1층이 지하층으로 산정된다(Table 20).
Table 20.
The process of calculating the underground floor, Alt 1
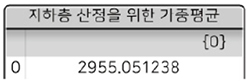
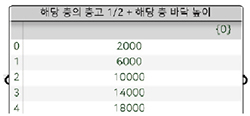
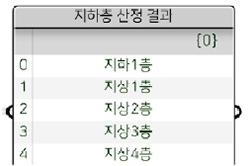
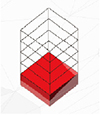
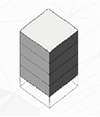
Table 21.
Objects and Figures for surface weighted average calculation, Alt 2
4.6.2 Alt 2
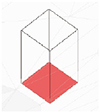
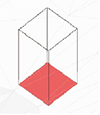
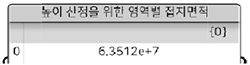
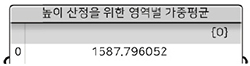
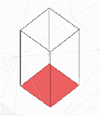
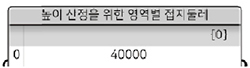
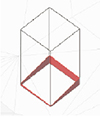
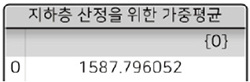
Table 18의 Alt 2의 경우, 고저차 3m 이하의 경사지에 위치하므로 건축 매스의 높이 산정과 지하층 산정을 위한 지표면 가중평균이 서로 같다. Alt 2 건축 매스의 접지면적 값은 약 63.51㎡이며, 접지둘레 값은 40m이다. Alt 2 건축 매스의 지표면 가중평균은 약 1.59m이다. 고저차 3m 이하의 경사지에 위치한 Alt 2 건축 매스의 높이와 지하층 산정은 1.59m부터 산정한다(Table 21).
Alt 2 건축 매스는 총 5개의 층의 4m 층고를 설정하였으며, 이는 Alt 1의 경우와 같다. 해당 층 층고의 1/2 값과 해당 층의 바닥 높이 값을 더한 값은 각각 1층 2m, 2층 6m, 3층 10m, 4층 14m, 5층 18m이므로, Alt 2 건축 매스의 지하층 산정을 위한 지표면 가중평균은 1.59m보다 낮은 값은 없다. Alt 2 건축 매스는 Table 22와 같이 지하층이 없는 지상 5층 건축 매스로 산정된다(Table 22).
Table 22.
The process of calculating the underground floor, Alt 2
4.6.3 Alt 3
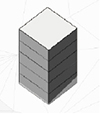
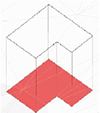
Table 18의 Alt 3의 경우, Alt 3 건축 매스 높이 산정을 위한 접지면은 수직 3m 영역으로 나누었을 때, 0~3m, 3~6m 영역의 접지면은 접지면 전체가 지하에 포함된다. 해당 접지면 객체는 시각화하지 않는다(Table 23).
Table 23.
Objects and Figures for surface weighted average calculation, Alt 3
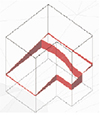
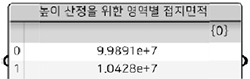
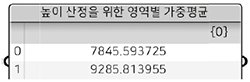
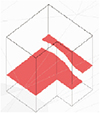
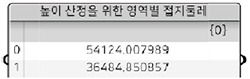
Alt 3 건축 매스의 높이 산정을 위한 접지면적은 수직 6~9m, 9~12m 영역 순으로 약 99.89㎡, 10.43㎡이다. Alt 3 건축 매스의 높이 산정을 위한 접지둘레는 수직 6~9m, 9~12m 영역 순으로 약 54.12m, 36.48m이다. 각각의 수직 3m 간격의 영역별 접지면적을 접지둘레로 나눈 값은 Alt 3 건축 매스의 높이 산정을 위한 지표면 가중평균으로 약 1.85m, 0.29m이다. 접지면 전체가 지하에 포함된 영역의 높이 값을 더해 높이 산정을 위한 지표면 가중평균은 영역별 7.85m, 9.29m가 되어 Alt 3 건축 매스 높이 산정 기준이 된다.
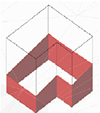
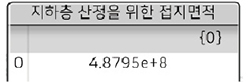
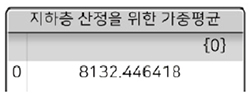
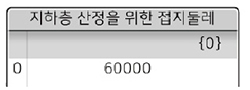
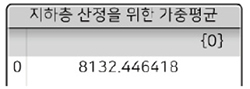
Alt 3 건축 매스의 지하층 산정을 위한 접지면적은 약 487.95㎡이며, 접지둘레는 60m이다. 해당 층 층고의 1/2 값과 해당 층의 바닥 높이 값을 더한 값은 각각 1층 2.5m, 2층 7m, 3층 11m, 4층 15m, 5층 18.5m이므로, 지하층 산정을 위한 지표면 가중평균은 약 8.13m이므로 지표면 가중평균보다 낮은 1, 2층이 지하층으로 산정된다(Table 24).
Table 24.
The process of calculating the underground floor, Alt 3
지표면 가중평균 산정을 위한 Table 18의 3가지 예시의 기존 Process는 Table 25와 같다. 이는 본 연구의 3가지 경우의 건축 매스의 지표면 가중평균 산정 소요시간과 비교하였을 때 상당한 차이가 있는 것을 확인할 수 있다. 이는 건축가가 기획설계의 초기 단계에서 같은 시간 대비 건축 매스의 이동과 지하 근입 깊이, 형태의 변형과 층고에 따른 다양한 시도가 가능할 것으로 보인다.
Table 25.
CAD-based calculation method Alt 1, 2, 3


5. 결론
5.1 지표면 가중평균 법정산정 알고리즘의 효율성
본 연구는 국토지리정보원에서 제공하는 수치지형도 연속 2.0 버전 데이터를 기반으로 Rhino3d Grasshopper 알고리즘을 통해 건축 매스의 지표면 가중평균을 신속하게 산정 및 검토할 수 있다. 위의 과정을 통해 건축 매스의 지표면 가중평균 산정이 되는 시간은 지형 및 건축매스의 형태에 영향을 많이 받으나 보통 10초 이내인 것으로 판단된다(AMD Ryzen 9 5900HS with Radeon Graphics 3.30 GHz, 32GB RAM 기준). 이는 예산을 책정하는 기획설계 초기단계에서 건축가가 건축물의 위치 및 지하 근입 깊이와 형태에 따른 면적산정에 소비되는 시간과 인적 자원의 투입을 최소화할 수 있음이 명확하다. 건축법의 건폐율과 용적률을 적용하여 면적검토가 자동화되는 프로그래밍은 많이 제공되고 있는 것에 비해 건축물의 높이와 지하층 산정을 위한 상세 부분까지 고려된 최적화 과정은 부족한 실정이다. 지표면 가중평균 법정산정 자동화 Grasshopper 알고리즘을 통해 건축물의 위치, 지하 근입 깊이, 형태 등 다양한 변수의 가중평균 산정을 기존 Process 대비 인적 자원 투입을 최소화하고 신속하게 산정할 수 있는 효율성을 가지고 있다.
5.2 지표면 가중평균 법정산정 알고리즘의 신뢰성
본 연구의 지표면 가중평균 법정산정 자동화 알고리즘은 지표면 가중평균 산정과 관련된 객체와 수치값을 추출할 수 있다. 이는 Grasshopper 알고리즘을 통한 객관적인 데이터로, 건축물의 영역별 높이 산정과 지하층 산정을 위한 지표면 가중평균 산정과정 및 결과를 법정산정 규정과 관련된 법규 준수의 여부를 검토할 수 있다.
5.3 지표면 가중평균 법정산정 알고리즘의 확장성
본 연구는 산지가 많은 한반도 지형의 다양한 특성에서 규모 검토를 위한 최대면적 및 즉각적인 디자인 변경에 따라 수지분석이 가능한 지표면 가중평균 법정산정 자동화 알고리즘의 첫 단계로 볼 수 있다. 본 연구 과정을 통해 Grasshopper 알고리즘 구성을 재현할 수 있는 것으로 판단된다. 이는 추후 연구를 통해 새로운 목적성을 가진 Grasshopper 알고리즘 Cluster를 자율적으로 추가하여 발전할 수 있을 것으로 보이며, 건축물의 디자인 과정에서 기존 소요시간 대비 다양한 분석을 할 수 있는 알고리즘의 확장성을 가질 것으로 보인다.
5.4 지표면 가중평균 법정산정 알고리즘의 제한성
1/1,000 축척 이상의 수치지형도 데이터는 대축척 지도로써 지형의 정확도와 정밀한 공간정보 및 범용성을 위해 상당한 예산이 투입되어야 하는 문제가 있다. 이에 본 연구에서는 국토지리정보원에서 제공하는 1/1,000 축척의 수치지형도 데이터를 사용하였다. 해당 데이터를 이용하여 지형 및 주변 건축물 3D Model을 생성하고 입력된 건축 매스의 지표면 가중평균 산정을 자동화하였다. 해당 연구에서 이용한 수치지형도는 등고선의 등고수치를 5m 간격으로 내포되어있다. 이에 해당 값을 이용한 지형 3D Model이 실제 지형과 100% 일치하는 것으로 판단하기 어렵다.
등고수치 5m 간격의 등고선을 이용하여 세밀한 등고선을 추출할 수 있지만, 단순히 등고선의 간격을 좁힌 결과물이므로 실제 지형의 형상과 오차의 가능성을 가지고 있어 지표면 가중평균 법정산정 또한 실측 데이터와 오차의 가능성을 가진다. 이에 본 연구는 건축 설계과정 중 사업대상지를 선정하여 지적측량단계 이전의 기획단계에서 초기에 검토하는 과정으로 지표면 가중평균을 참고할 수 있는 알고리즘으로 판단된다.
